DHIS2 data pipeline
Overview
Table and column names in the AP are similar, but not identical to DHIS2, and not all tables are ingested. The general structure however remains, with one table for aggregate data, separate tables for each program and separate tables for metadata, such as categories, data elements and org units.
Table naming
Each data pipeline specifies a schema and a data warehouse base table name. The base table name then becomes the prefix to all tables contained within it. For example, for a data pipeline with base name data, the datavalue table will be named data_datavalue.
There are two versions of the aggregate data tables that are created by default.
| Version | Table name | Description |
|---|---|---|
| Narrow | datavalue | For most queries. There are fewer columns to manage, however it will require joining with other metadata tables to get all the information you need. |
| Wide | analytics | Ad-hoc analysis. Most of the metadata tables are joined in this table, however it requires familiarity with the column structure. |
Table structure
This section describes the tables which are created and loaded by the DHIS2 data pipeline.
Data tables
The DHIS2 data pipeline creates and loads tables for aggregate data, complete data set registrations, program events, program enrollments, tracked entities and relationships.
| Table name | Description |
|---|---|
| Audit | Audit table |
| Data | Wide aggregate data table |
| Data value | Narrow aggregate data table |
| Complete data set registration | Completed datasets |
| [Program name] - Event | Tracker/event data table |
| [Program name] - Event audit | Tracker/event audit table |
| Enrollment | Tracker enrollment data table |
| Tracked entity attribute value | Tracked entity attribute value table |
| Tracked entity instance | Tracked entity instance data table |
| Relationship item | Relationship data table |
Metadata tables
Metadata tables are split into their component parts. The wide data value table includes most of the key metadata information, however it might be neccessary to build a star schema in joining metadata tables. There are additional metadata tables suffixed with 'structure' which are automatically created by AP to avoid having to make as many table joins.
| Data elements |
|---|
| Data element |
| Data element group |
| Data element group members |
| Data element structure |
| Data element group set |
| Data element group set members |
| Data element group set structure |
| Categories |
|---|
| Category |
| Category structure |
| Category combination |
| Category combinations and categories |
| Category combinations and option combinations |
| Category option |
| Category option and organisation units |
| Categories and category options |
| Category option combination |
| Category option combination structure |
| Category option combinations and category options |
| Category option group |
| Category option group members |
| Category option group set |
| Category option group set members |
| Organisation Units |
|---|
| Organisation unit |
| Organisation unit structure |
| Organisation unit group |
| Organisation unit group members |
| Organisation unit group set |
| Organisation unit group set members |
| Organisation unit group set structure |
| Time periods |
|---|
| Period |
| Period structure |
| Relative monthly period |
| Relative quarterly period |
| Relative yearly period |
| Data Sets |
|---|
| Data set |
| Data set element |
| Programs |
|---|
| Program |
| Program stage |
| Tracked Entities |
|---|
| Tracked entity attribute |
| Tracked entity type |
| Relationships |
| Relationship structure |
| Relationship constraint |
| Relationship type |
| Relationship type structure |
| Indicators |
|---|
| Indicator |
| Indicator group |
| Indicator group members |
| Indicator group set |
| Indicator group set members |
| Program indicator |
| Dimension |
Filters for event and tracker data
DHIS2 event and tracker data can be filtered by data elements and tracked entity attributes. The filters are read from the DHIS2 configuration, meaning that specific properties can be set in the Maintenance app of the relevant DHIS2 instance. AP will exclude data elements and tracked entity attributes which are marked for exclusion as part of data loading.
Start by navigating to and logging into the relevant source DHIS2 instance.
Program data elements
To skip a data element in a program stage, enable the Skip in analytics property.
- Go the the Maintenance app in DHIS2.
- Click Programs.
- Click Programs.
- Find the relevant program and click to edit it.
- Click Program stages in the left-side menu.
- Find the relevant program stage and click to edit it.
- Click Data.
- Find the relevant data element in the list of data elements.
- In the Skip in analytics column, select the checkbox for the data element.
- Click Save stage and close.
- Click Save and close.
Tracked entity attributes
To skip a tracked entity attribute for all programs, enable the Skip synchronization property for the attribute.
- Go the the Maintenance app in DHIS2.
- Click Programs.
- Click Tracked entity attributes.
- Find the relevant tracked entity attribute and click to edit it.
- Click Data handling.
- Select the checkbox for the Skip synchronization for this attribute and its values property.
- Click Save and close.
Filters for dimensions
DHIS2 dynamic dimensions can be filtered through the data dimension object properties in the DHIS2 configuration. In DHIS2, dynamic analytics dimensions are supported by the following entities.
- Categories
- Data element group sets
- Org unit group sets
- Category option group sets
Columns in the wide analytics tables in DHIS2 will be generated for each dimension object for which the data dimension property is enabled.
To exclude a specific dimension, the data dimension property can be disabled for the dimension object. For the wide aggregate analytics table in the AP DHIS2 data pipeline, AP will exclude dimension objects for which the data dimension property is disabled and not create corresponding table columns.
The steps for disabling a dimension entity object below is specific to DHIS2 categories, but the steps are similar for all dimension entities.
- Go the the Maintenance app in DHIS2.
- Click Categories.
- Click Categories.
- Find the relevant category and click to edit it.
- Unselect the checkbox for Show as data dimension in analytics apps.
- Click Save and close.
Indicator to DAX converter
The DHIS2 indicator to Power BI DAX converter allows for performing the expression logic from DHIS2 indicators in Microsoft Power BI through DAX (Data Analysis Expressions).
Data Analysis Expressions (DAX) is the formula language used in Power BI for custom calculations, data modeling, and advanced analysis. It id similar to Excel formulas but operating on data relationships. It enables creating measures, calculated columns, and tables, with specialized functions for time intelligence, aggregation, and filtering.
The DHIS2 indicator to DAX converter is available under the DHIS2 data pipeline. The list of DHIS2 indicators is retrieved from the DHIS2 source system for the specific DHIS2 data pipeline.
- Click Data catalog in the left-side menu.
- Find the relevant DHIS2 data pipeline.
- Click the data pipeline name to view data pipeline information.
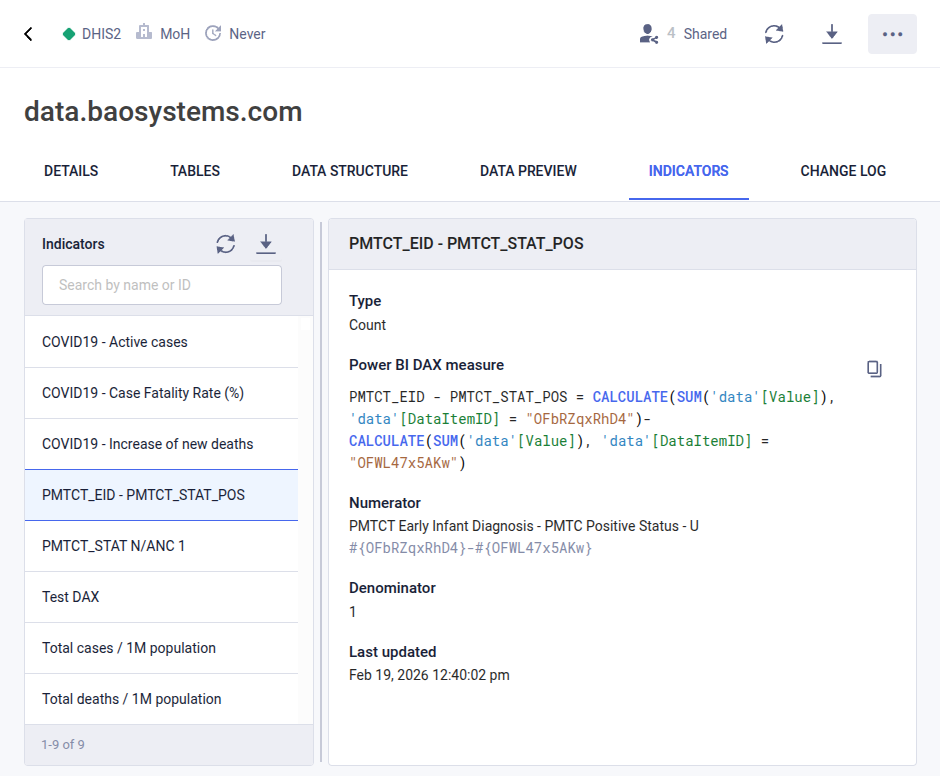
- Click the Indicators tab.
- Click the relevant indicator in the list of indicators.
- View information about the indicator and the corresponding DAX in the right-side panel.
- Click the Copy icon to the right to copy the DAX.
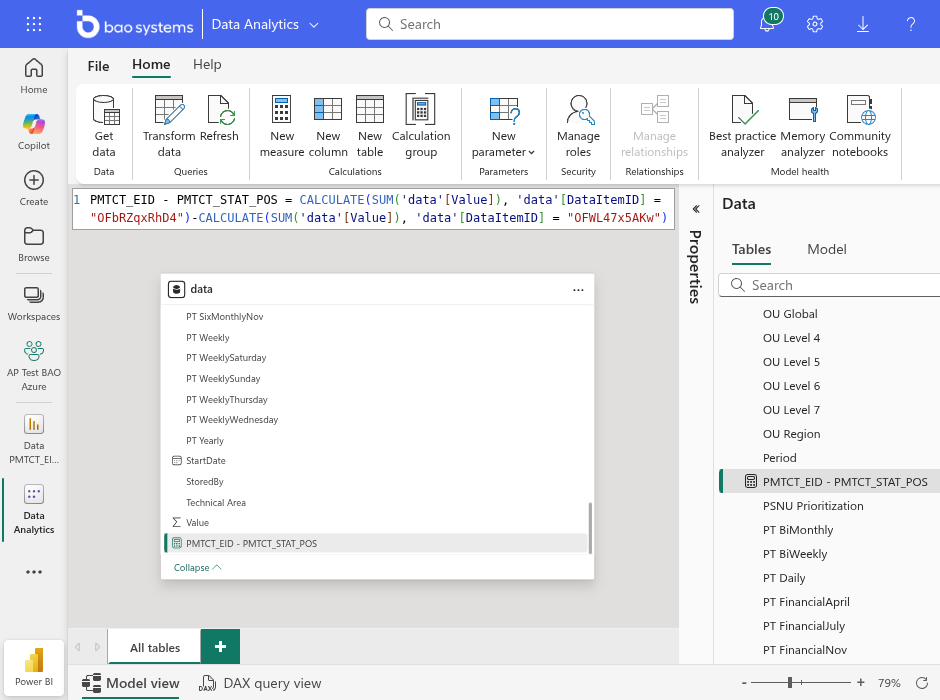
After loading data with the DHIS2 data pipeline and creating a semantic model in Power BI, you can instantly create new measures by pasting the DAX from AP directly into Power BI DAX input area.