Data browser
Overview
Data browser is a core component of AP, designed to empower users to engage directly with their data through interactive querying across all available datasets. This allows for exploring data in near real-time, enabling users to derive insights and make informed decisions rapidly.
In AP, data pipelines automates the ingestion of data from multiple sources into the central data store. These pipelines are configured to handle diverse data formats and sources, such as applications, databases and data files, ensuring that the data is up-to-date and readily accessible. Once the data is in the platform, users can create queries which span all data sources and datasets, allowing for integrated data exploration and analytics.
The main query language of the data browser is SQL, or Structured Query Language. SQL is a standardized language for managing and manipulating databases and data warehouses. SQL provides a powerful means to execute queries on data in a declarative style. It allows users to specify exactly what data they need from a database without requiring detailed knowledge of how the database is structured or stored. Typical operations are selecting specific data, aggregating data across dimensions, filtering data on particular values and joining tables together. SQL is widely known and used among data professionals, making it a common language for data exploration and analysis.
In AP, a SQL query can be saved as a view. The view can be logical and materialized, where the latter option means the result set produced by the view is stored for faster retrieval, at the cost of having to be refreshed periodically. The saved view which is current visible in the query editor is referred to as the active view.
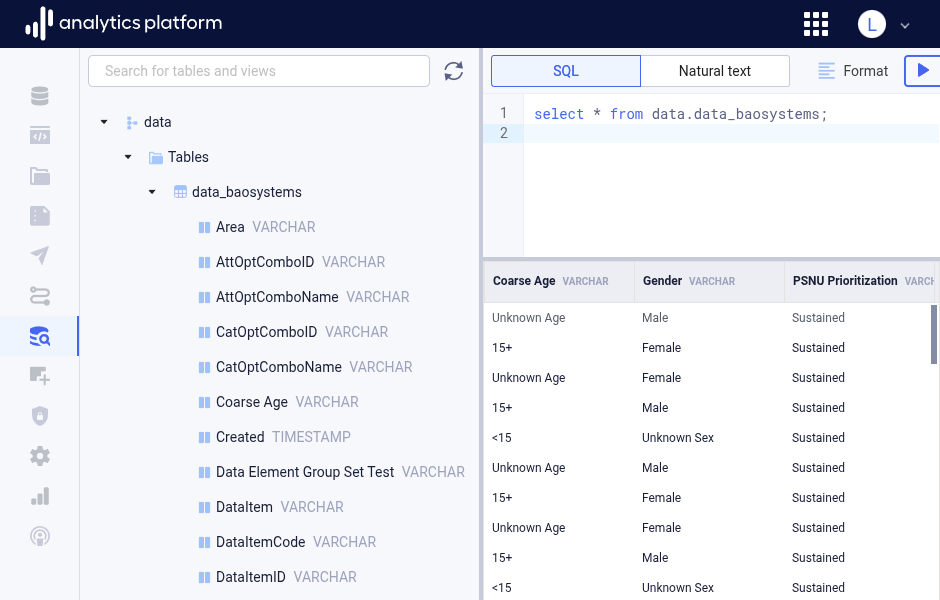
Schema navigator
The data warehouse schema navigator is placed on the left-side panel of the data browser. It outlines the entire schema of the data available to the user. The schema is displayed as a hierarchy, where the first level represents table schemas, the second level represents tables and the third level represents table columns.
| Level | Description |
|---|---|
| 1 | Schema |
| 2 | Tables |
| 3 | Columns |
Expanding an item in the hierarchy will reveal items at the next level. The column data type is displayed next to each column name. If a column has a foreign key to another table and column, a key icon is displayed to the left of the column name. Hovering the key icon will display the table and column which the foreign key refer to.
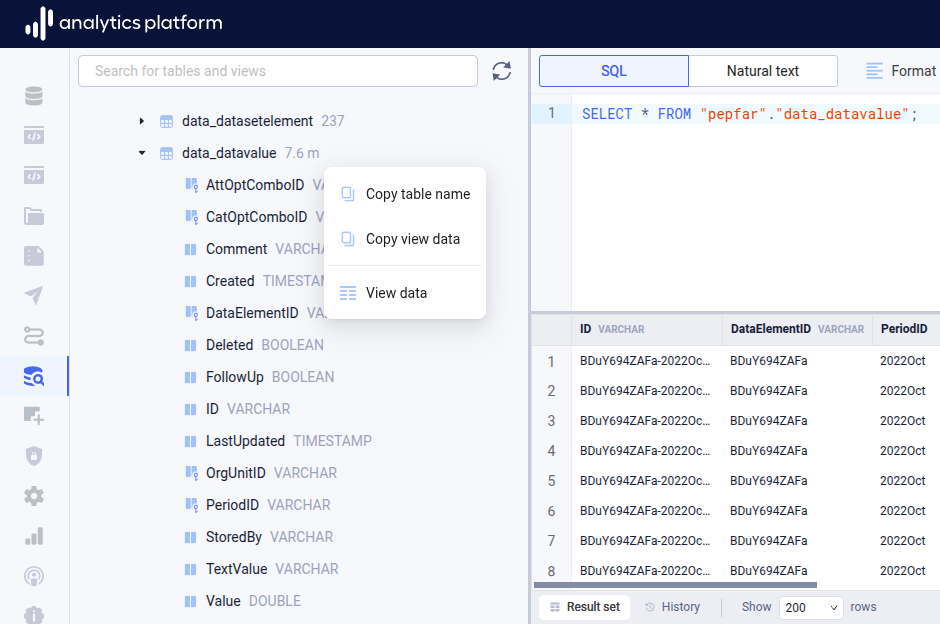
Using schema operations
To access table operations, hover and click the menu icon to the right of a table name. The following operations are available.
- Copy table name: Copies the name of the table to the clipboard.
- Copy select: Copies a SQL query for reading table data to the clipboard.
- Copy select with columns: Copies a SQL query for reading table data specifying all table columns to the clipboard.
- Copy select count: Copies a SQL query for counting the number of table rows to the clipboard.
- Copy create table: Copies a SQL statement for creating the table.
- View data: Inserts a SQL query for reading table data into the query area and runs the query.
To access column operations, hover and click the menu icon to the right of a column name. The following operations are available.
- Copy column name: Copies the name of the column to the clipboard.
Refreshing schema
The refresh the schema, click the refresh icon in the top right corner of the schema navigator.
It may be necessary to refresh the data warehouse schema after making changes to it, for example by creating new schemas and data pipelines,
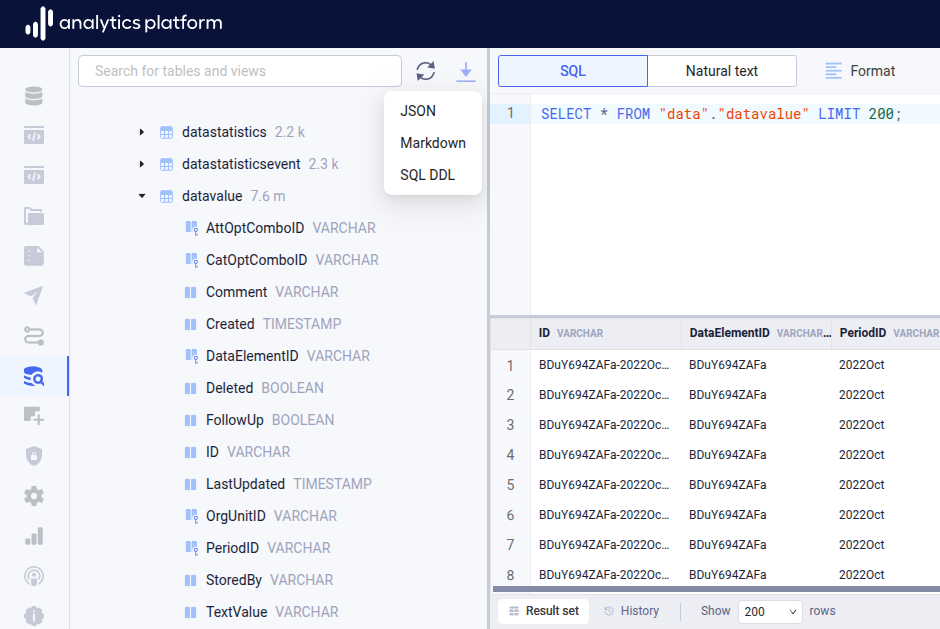
Downloading schemas
Schema information can be downloaded from the download button at the top of the schema navigator.
- Click the Download schemas button to open the context menu.
- Click the desired format for the schemas download.
The following formats are supported.
- JSON (.json)
- Markdown (.md)
- SQL DDL (.sql)
- Semantic (.semantic)
Query editor
The query editor is placed at the center of the data browser. This is the area where the query can be specified. There are two types of queries: SQL and Natural text. The type of query to work with can be selected at the top bar.
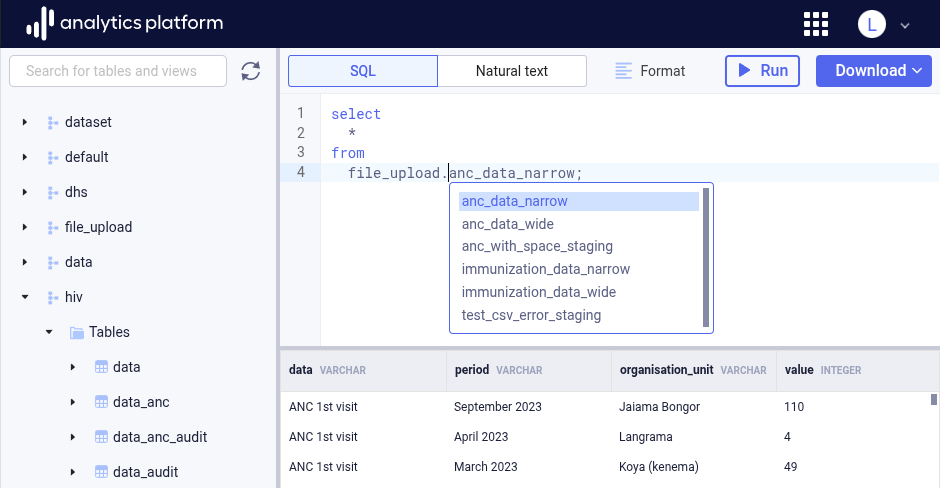
Writing queries
Users can write their SQL queries directly into the query editor area. The editor supports auto-completion of SQL statements to make writing more efficient. To activate auto-complete, press Ctrl + Space (Windows/Linux) or Command + Space (macOS), with the cursor at the relevant position of the query.
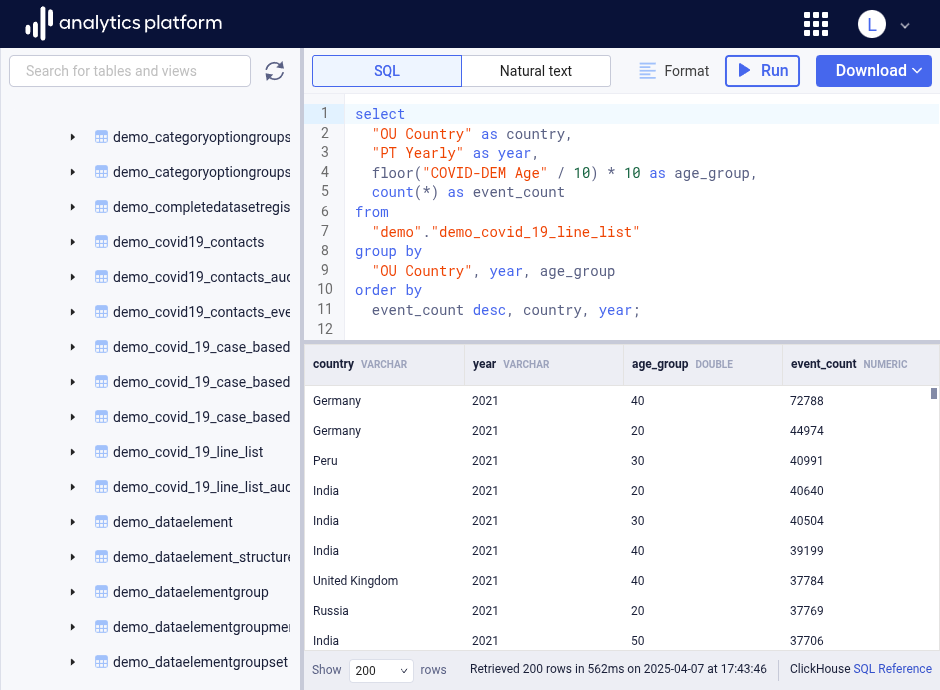
Executing queries
After writing a SQL query, click the Run button (with the play icon) to execute the query.
Formatting queries
To format a SQL query to make it more readable, click Format on the top bar.
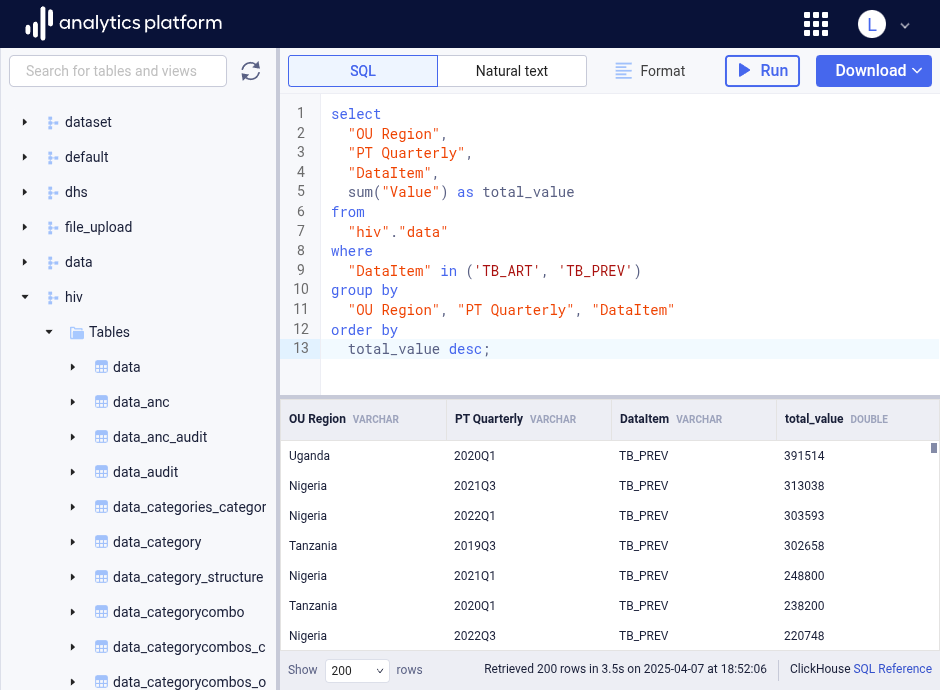
Viewing results
The query response will appear in the result area. The query result is displayed as a table, with the name and the data type of each column displayed on the header row. By default, the first 200 rows of the result are displayed. The number of rows to display can be changed from the bottom bar drop-down to 500 or 1000.
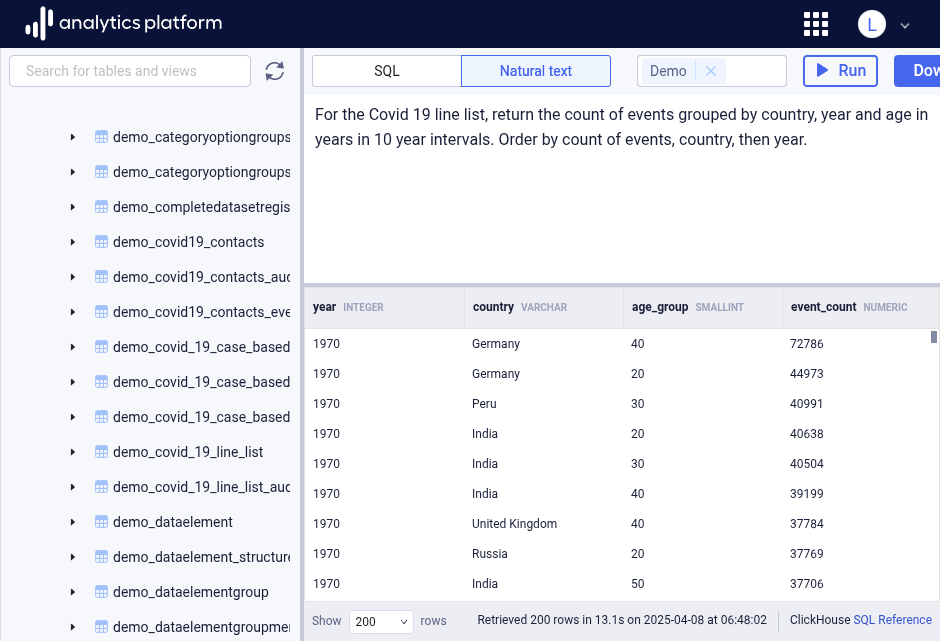
Natural text queries
Users who are not proficient in SQL can write queries in natural language text. Click Natural text in the top bar to switch to natural text queries. Select one or more schemas from the schema selector at the top bar to narrow down the part of the schema to retrieve data from.
With text queries, a user can ask simple questions about metadata, for example:
The result of metadata queries can be used to ask more sophisticated data questions, for example:
Give me the sum of data values for data items related to TB_ART and TB_PREV by
quarter and OU Region level. Include the data item. Order by data value descending.
Reasoning levels
In natural text mode, a reasoning level drop-down is available in the data browser top bar with options for fast and thinking reasoning levels.
- Fast: Appropriate for simple to moderately complex natural text queries. It returns SQL queries quickly with a low LLM token usage. For Google Gemini, the latest Flash-Lite model is used with thinking level low.
- Thinking: Appropriate for complex natural text queries. It returns SQL queries typically within 2 to 8 seconds with a moderate LLM token usage. For Google Gemini, the latest Flash model is used with thinking level low.
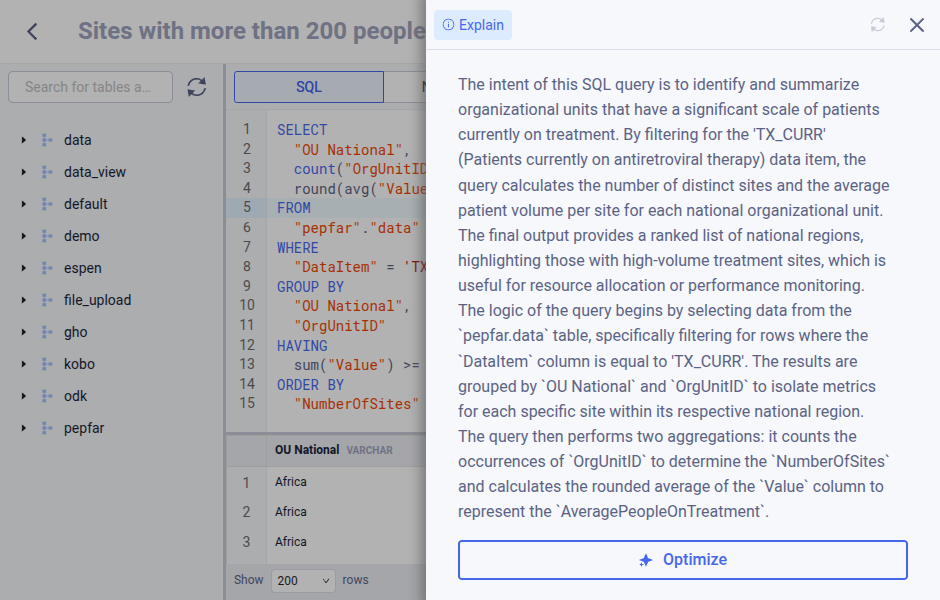
Explaining query
The data browser can provide explanations for SQL queries in plain language. When opening a SQL query from a view, click the right-side panel. The panel will open and display an explanation of the SQL query in plain text.
Downloading query result
After a query has run successfully, the result of the query can be downloaded to a data file in CSV format. The user is provided with two options.
Download preview
Downloads the rows which are visible in the result area. The number of rows can be changed from the bottom bar drop-down. The format is uncompressed CSV.
Download full dataset
Downloads the entire set of rows produced by the query. This download option will stream results to the web browser. The format is Gzip compressed CSV. Note that downloading extremely large datasets is not recommended.
Tools for decompressing Gzip files are pre-installed on MacOS and Linux. The 7-Zip tool is recommended for Microsoft Windows.
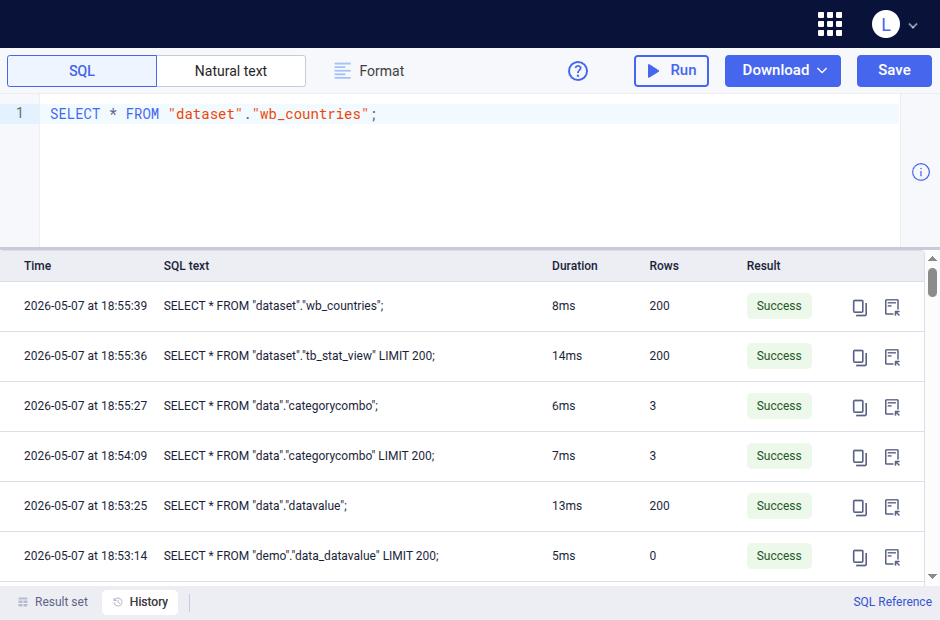
Viewing query history
The history of SQL queries that have been executed is accessible by clicking History in the bottom bar. The history displays the queries executed by the logged in user only in reverse chronological order.
The following fields are displayed.
- Time: Start time of the query execution.
- SQL text: SQL query text.
- Duration: Duration of the query execution.
- Rows: Number of rows returned by the query.
- Result: Result status of the query execution, can be Success or Error.
The following operations are available for each query in the history.
- Copy: Copies the query text.
- Insert: Inserts the query text into the query area.
Keyboard shortcuts
The following keyboard shortcuts are available for the data browser.
| Operation | Shortcut |
|---|---|
| Run query | Ctrl + Enter |
| Save query | Ctrl + S |
| Format query | Ctrl + Shift + F |
| Download preview | Ctrl + Shift + S |
SQL reference
SQL is a standard query language defined by ANSI which ensures interoperability across data warehouses supported by AP. Numerous courses and guides exist online for learning purposes.
However, every data warehouse provides a range of specific features and functions. Users writing SQL queries can learn about data warehouse specific functions by consulting the respective SQL reference guides listed below. You can observe the type of data warehouse from the right-side label at the bottom bar, and explore the respective SQL guide by clicking the SQL reference link next to it, or from the table below.
| Data warehouse | SQL reference guide |
|---|---|
| PostgreSQL | www.postgresql.org |
| Amazon Redshift | docs.aws.amazon.com |
| ClickHouse | clickhouse.com |
| SQL Server | learn.microsoft.com |
| Synapse | learn.microsoft.com |
Views
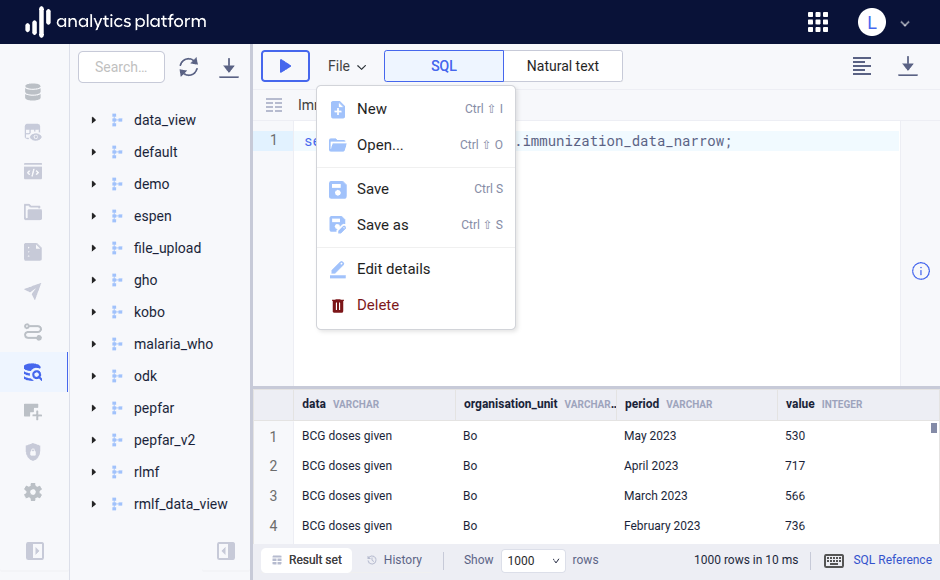
A saved SQL query in AP is referred to as a view. A view can be saved, updated, shared and deleted. Views can be managed using the File menu from the top menu bar. The name of the active view is displayed in the view bar immediately below the top menu bar.
Create view
- If an active view is present, click File from the top menu, then click New.
- Write the SQL query in the data browser query area.
- Click File from the top menu to open the file menu.
- Click Save as.
-
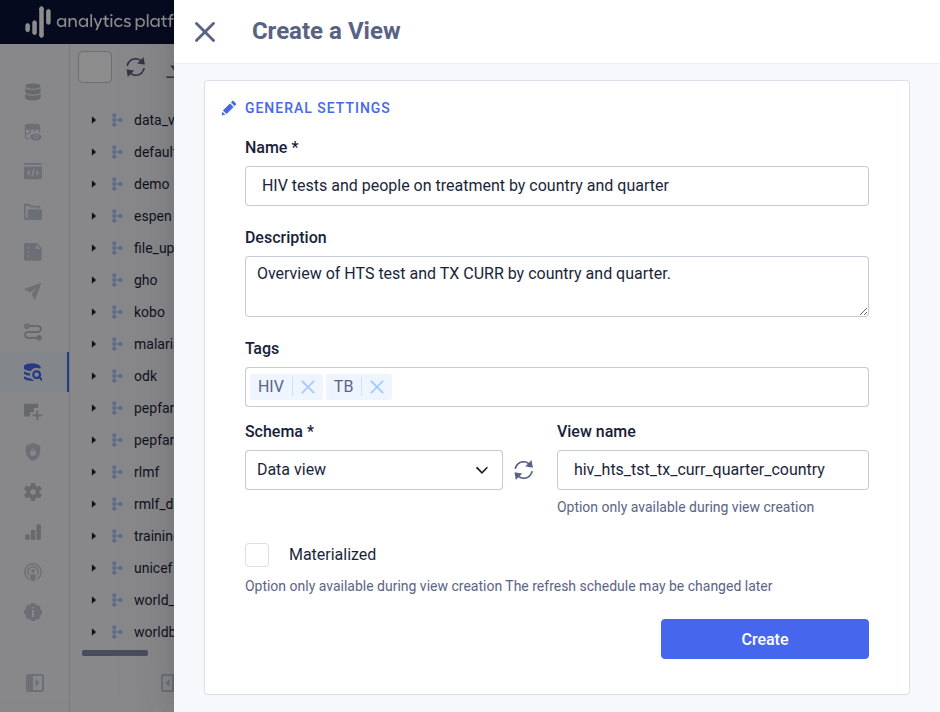
Enter the following information.
Field Description Name The name of the view Description A description of the view Tags Free text tags which categorizes the view Schema The schema in which to store the view View name The name of the data warehouse view, meaning the name as it will appear in the data warehouse Materialized Whether the view should be logical or materialized. -
Click Create.
Open view
- Click File from the top menu to open the file menu.
- Click Open to open the view list dialog.
- Click the name of the view to open.
Update view
- Open the relevant view and make the required changes to the query.
- Click File from the top menu to open the file menu.
- Click Save to update the active view with the query changes.
Edit view details
- Open the relevant view.
- Click File from the top menu to open the file menu.
- Click Edit details to open the view details dialog.
- Edit values in the relevant fields.
- Click Save to update the active view.
- Close the dialog by clicking the close icon in the top-left corner.
Remove view
- Open the relevant view.
- Click File from the top menu to open the file menu.
- Click Delete.
- Click OK in the confirmation dialog to remove the active view.