Overview
Welcome to the user guide for Analytics Platform (AP from now on). AP lets you ingest and merge, in real time, data from multiple and varied data sources together in a scalable data warehouse. The AP is designed with easy-to-use connectors (data pipelines) for platforms, systems and tools commonly used by governments and development organizations supporting them.
Publicly available and global datasets ranging from population and demographic, health, nutrition, agriculture and food security, geological, and economic data are made available through AP to enhance your programmatic data, enabling data triangulation within and across sectors to generate better insights.
Data in the warehouse are available for advanced analytics, machine learning and predictive analytics, and widespread sharing using popular third party business intelligence (BI) tools.
AP offers a user-friendly interface and seamless flow, from data ingestion to visualization, so that organizations can reduce staff time spent on curating, managing, and manipulating data, and instead focus on generating actionable insights from their data to inform programmatic decision making.
Key platform features
- Data ingestion: The platform provides connectors (data pipelines) to systems, databases and tools commonly used in the international development sector.
- Data transformation: Data can be transformed and enriched using SQL views, Python scripts and R scripts upon ingestion. Furthermore, data sets can be parsed and joined to create unique data views for enhanched analysis.
- Natural text queries: Users can ask data questions in natural text and have AP convert to SQL queries for informational retrieval, allowing non-technical users to analyze and retrieve data.
- Data warehousing: Data is organized and stored in a scalable cloud-based warehouse. AP integrates with ClickHouse, PostgreSQL, SQL Server, Amazon Redshift, Azure SQL Database and Anzure Synapse.
- Import of public data sets: The platform offers easy import of publicly accessible data sets. A range of datasets exist within the library, including from the UN, WHO Global Health Observatory and World Bank.
- User management: Users and user groups can be managed, and fine-grained access control provided through a multi-dimensional security model.
- Monitoring, logging and alerts: The platform provides monitoring, logging and alerts on failures so that issues can be immediately detected and corrected.
- Analytics and BI tool integration: The platform supports most leading analytics and business intelligence tools, including Power BI, Tableau, and Superset, to create customized visualizations and dashboards.
- Embedded visualization: Data visualization and dashboards can be embedded in popular systems including DHIS2 using the Super BI web app, allowing visualizations to be consumed with existing user accounts.
- Security: Data is encrypted during transit and at rest in the data warehouse. AP offers firewall management for BI tool connections.
ETL vs ELT
Until recently, expensive data storage and underpowered data warehouses meant that accessing data involved building and maintaining fragile ETL (Extract, Transform, Load) pipelines that pre-aggregated and filtered data down to a consumable size. This meant you had to decide up front which data elements and fields were to be ingested. Technological advances now makes the life of data analysts easier. Practically free cloud data storage and a lot more powerful, modern, columnar cloud data warehouses make fragile ETL pipelines a relic of the past. Modern data architecture is ELT (Extract, Load, Transform): Extract and load the raw data into the destination, then transform and model it after load. ELT has many benefits, including increased versatility and usability.
Data pipelines
AP offers turn-key data pipelines to popular information systems, databases and public cloud blob stores. The data pipelines are designed to just work, meaning automatically adapting to changes in the source system, such as new data fields becoming available and changes to existing fields. The primary value is that you can define a data pipeline and forget it, allowing the platform to keep it up to date. Data will be loaded through full refreshes or incremental updates. In the case of a data pipeline failing, e.g. because the authentication is no longer valid, AP provides alerts so that you can take timely action.
Data pipelines use a combination of API calls and database connections, depending on the nature and capability of the data source. AP offers fast data synchronization, ensuring you have data that are correct and up-to-date.
AP offers strong security. The platform encrypts secrets such as passwords and API keys before they are stored, using strong algorithms and encryption keys. Communication with data sources and data warehouses are encrypted using TLS/SSL.
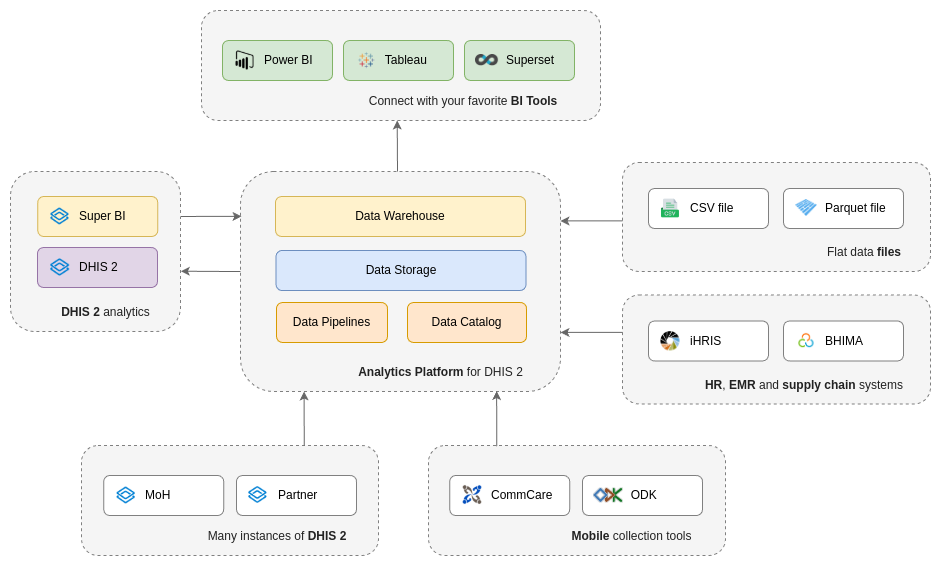
Data flow
AP allows for ingesting data from a variety for data sources including systems, databases and files using data pipelines. The data is stored in the data storage area and loaded into the data warehouse of the platform. This makes the data available for analytics using a variety of tools. This includes BI tools, such as PowerBI and Tableau, data exploration tools like Apache Superset and the Super BI web app for DHIS2. Data can be aggregated and loaded back to DHIS2 using destinations. A high level diagram with a typical data flow is found below.
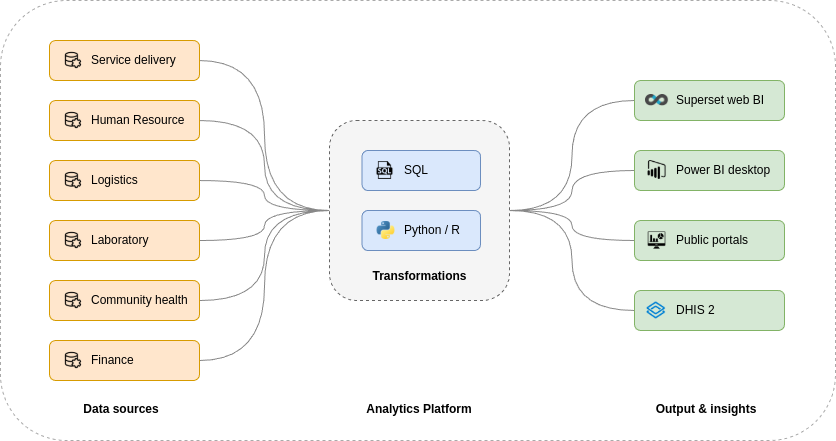
Integrated data repository
AP follows the ELT (extract, load and transform) approach for data loading and integration. Data pipelines are responsible for retrieving data of interest from source systems and loading it into the platform. From there, data can be mapped, transformed and aggregated using views in order to produce data analytics and insights. This approach reduces the challenges of complex, fragile and slow ETL (extract, transform and load) jobs, where you have to decide up front which datasets and fields to ingest. The diagram below illustrates a typical integration scenario.
Bring your own analytics tools
AP integrates and streamlines your data and makes it easy to consume from a variety of BI and data visualization tools.
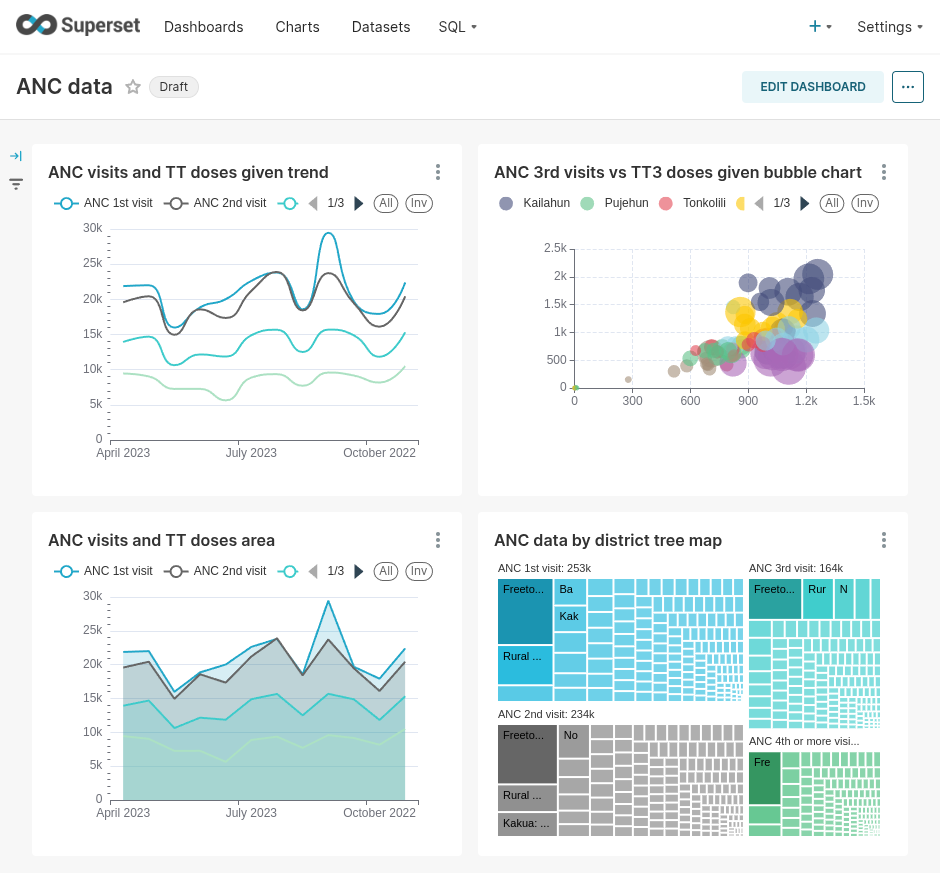
- Apache Superset: Superset is integrated as the default data exploration tool, providing comprehensive and flexible data visualizations.
- BI tools: Users can easily connect both the cloud and desktop versions of popular BI tools such as Power BI and Tableau.
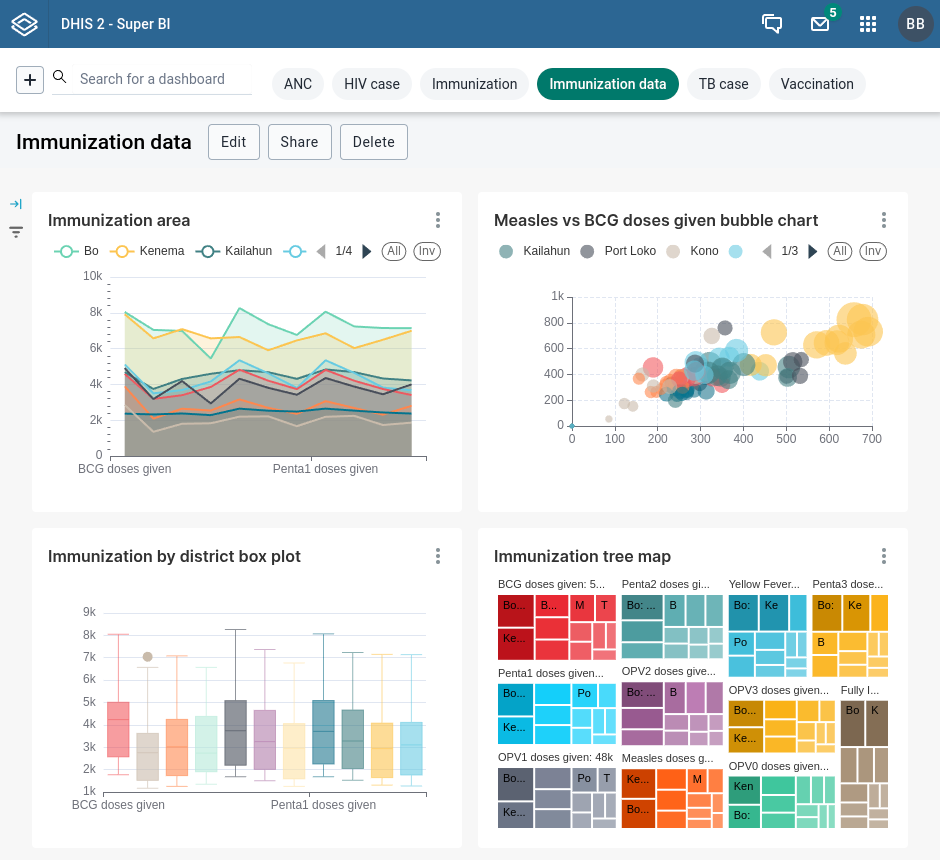
- Super BI for DHIS2: Dashboards can be embedded within DHIS2 with the Super BI web app, even without loading the data into DHIS2.
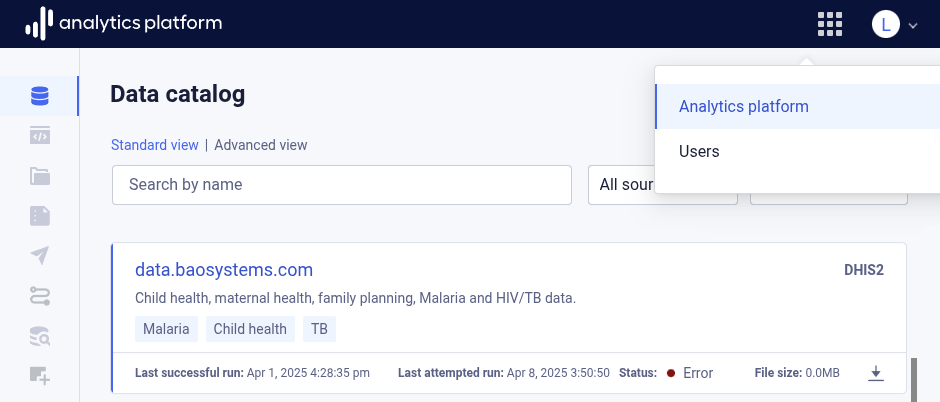
Spaces
The AP front-end is composed of two main spaces.
- Analytics Platform
- Users
You can navigate to each space by clicking on the app menu in the header bar, followed by Analytics Platform or Users. Which spaces are visible depends on the permissions of the user.